Tuning a CANrange
A tuned CANrange is especially important to make sure detection is accurate and reliable!
Read through this guide for some more in depth examples and instructions:
https://v6.docs.ctr-electronics.com/en/latest/docs/application-notes/tuning-canrange.html
CANrange Overview
CANranges output many signals to plot in Phoenix Tuner/AScope, however Distance, SignalStrength, and IsDetected are the 3 most important ones:
- Distance is a measure (in meters) of how far an object is from the sensor
- SignalStrength is how accurate the CANrange thinks the distance is
- IsDetected is a true/false boolean (1 for true & 0 for false) of whether the CANrange detects something → dependent on the tuning you will do below
Make sure to add these 3 signals to the plot while tuning!
Tuning in Phoenix Tuner
Go to the Config section of the CANrange → the values under the FOV Params & Proximity Params headers are the main values you will be tuning for accurate readings.
FOV CenterX / CenterY
These values (in degrees of rotation) are used to tell the CANrange where the center is and where it should be looking for objects.
-
-11° to 11°
FOV RangeX / RangeY
These values (also in degrees of rotation) are used to tell the CANrange how far away it should look from the center for objects
- 7° to 27°
|
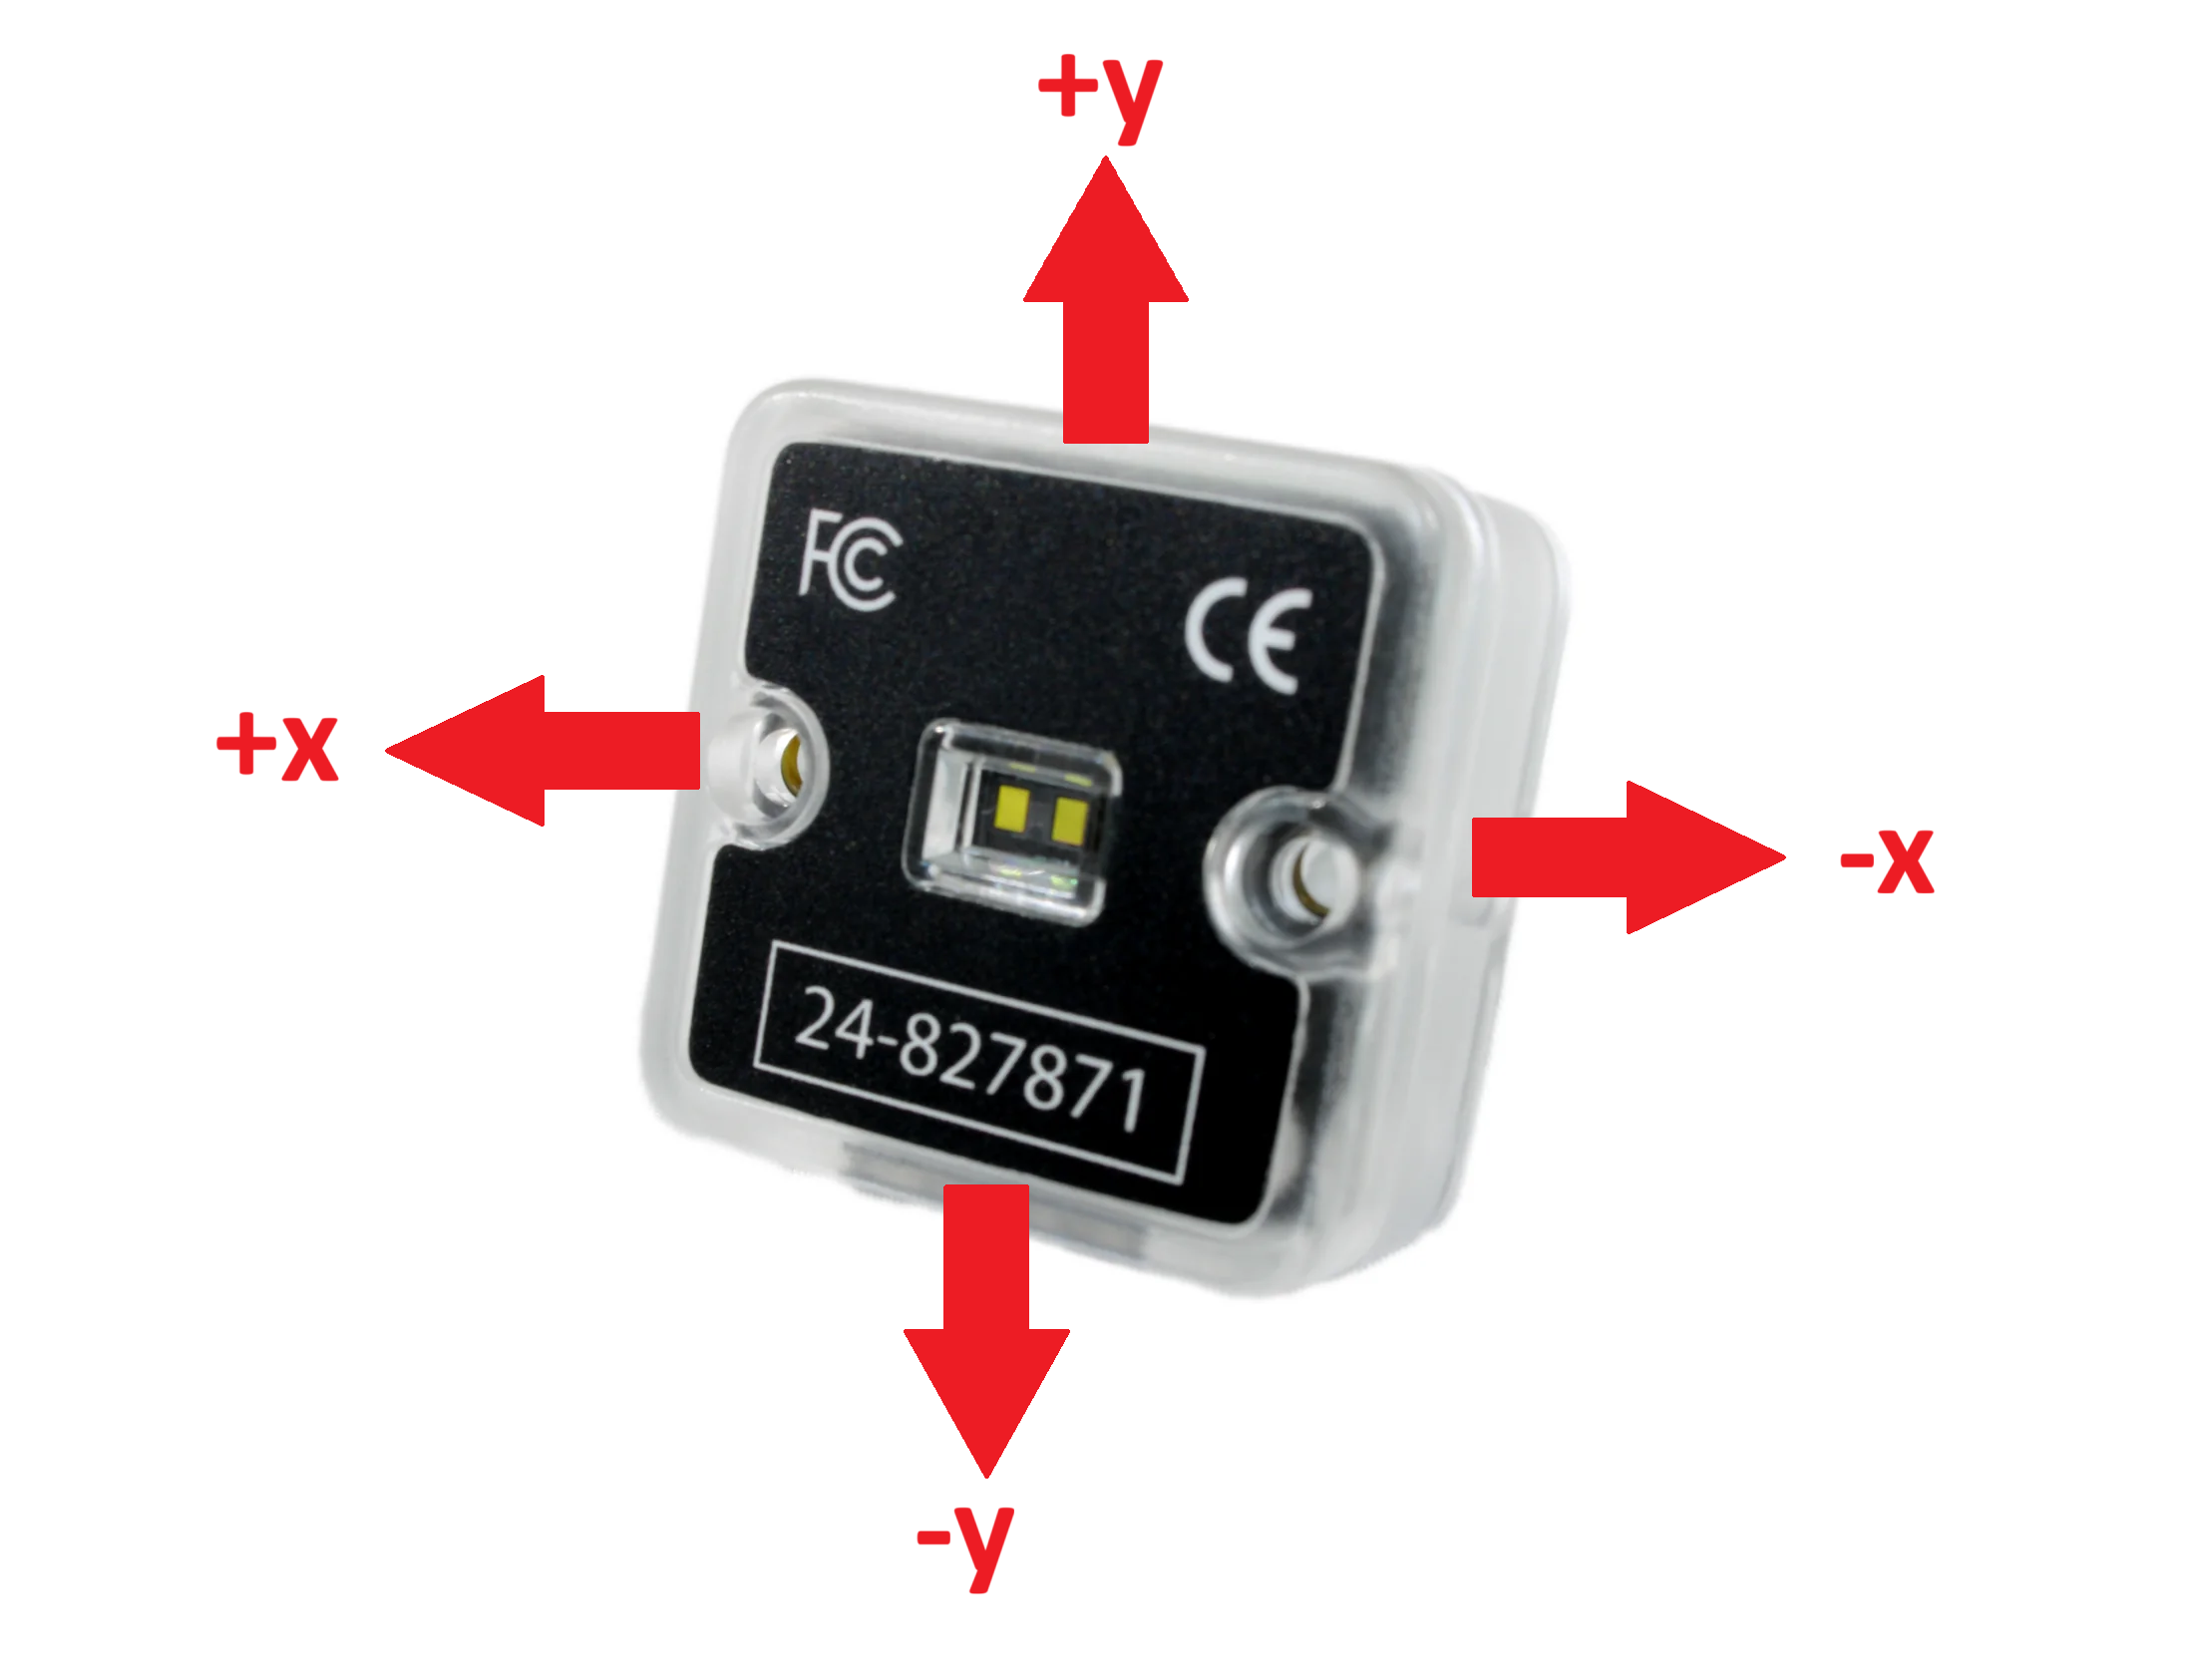
Use this handy dandy image to check which directions are x, y, positive, and negative:
(The actual sensor part facing towards you) |
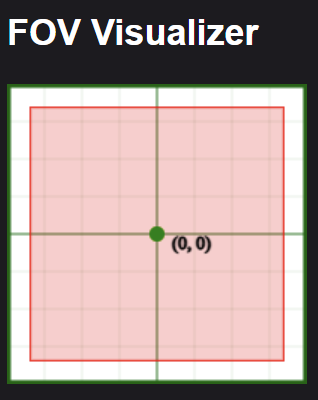
There is also an FOV Visualizer in Self Test that helps you see more clearly where the CANrange is looking: |
Min Signal Strength For Valid
This is set to 2500 as a default, and this a pretty good starting value. Check your plot for SignalStrength to see if you should adjust this value to be higher or lower.
Proximity Threshold
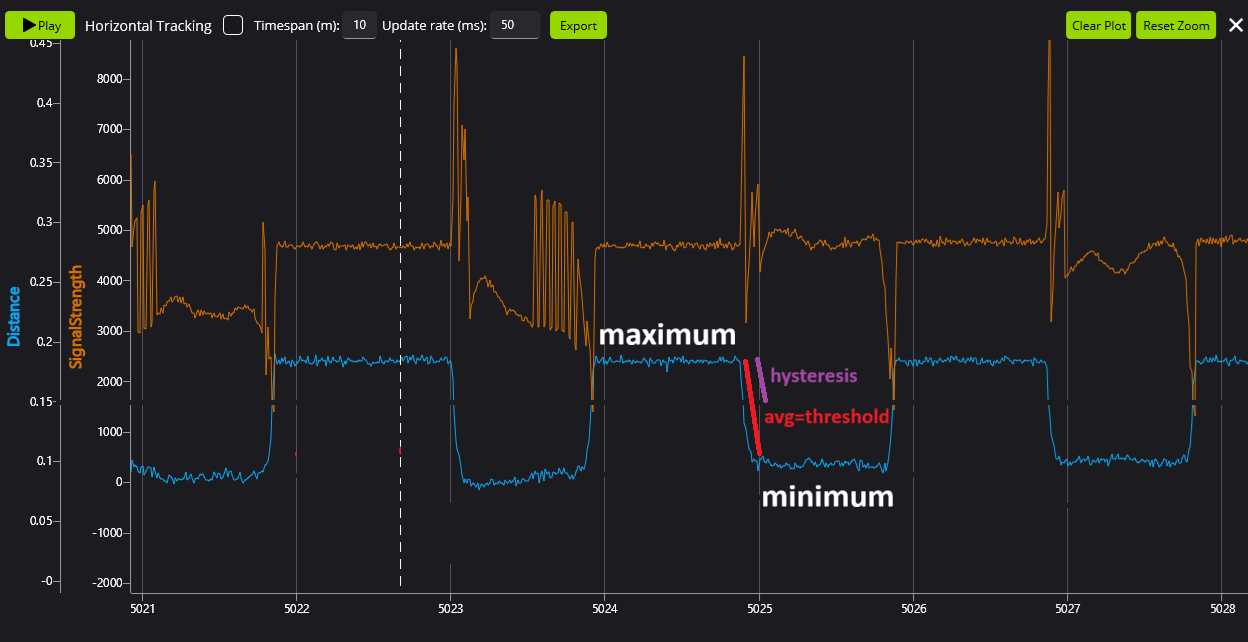
This is the most important value to tune! If the distance is less than this value, then the object is detected. Make sure you are plotting Distance on the graph, and then:
- Place an object in front of the CANrange and see the distance decrease on the plot → this is the minimum distance
- Remove the object from the CANrange and see the distance increase on the plot → this is the maximum distance
- Average the values of minimum and maximum distances together, and this is your new Proximity Threshold (in meters)
Proximity Hysteresis
This value (in meters) tells the CANrange the extra distance less from the Proximity Threshold before it recognizes the object as detected and the extra distance more before the object is no longer detected.
For example if the Proximity Threshold was 1.0m and the Proximity Hysteresis was 0.1m then
- When the distance is ≤ 0.9m, the object is detected
- When the distance is ≥ 1.1m, the object isn't detected anymore
Proximity Hysteresis is especially useful when the CANrange is detecting in a noisy environment, and it allows the distance to change quickly without it thinking it's no longer detected.
The Hysteresis should generally be a little bit less than the difference between your Threshold and your maximum/minimum
Your CANrange is now tuned! It's always a good idea to fiddle around with the values a little bit to get your desired output, but this is a great starting place!
No Comments